This is exactly what you get when you upload a chart
One screenshot in — a clear call, levels, reasons and scenarios out.
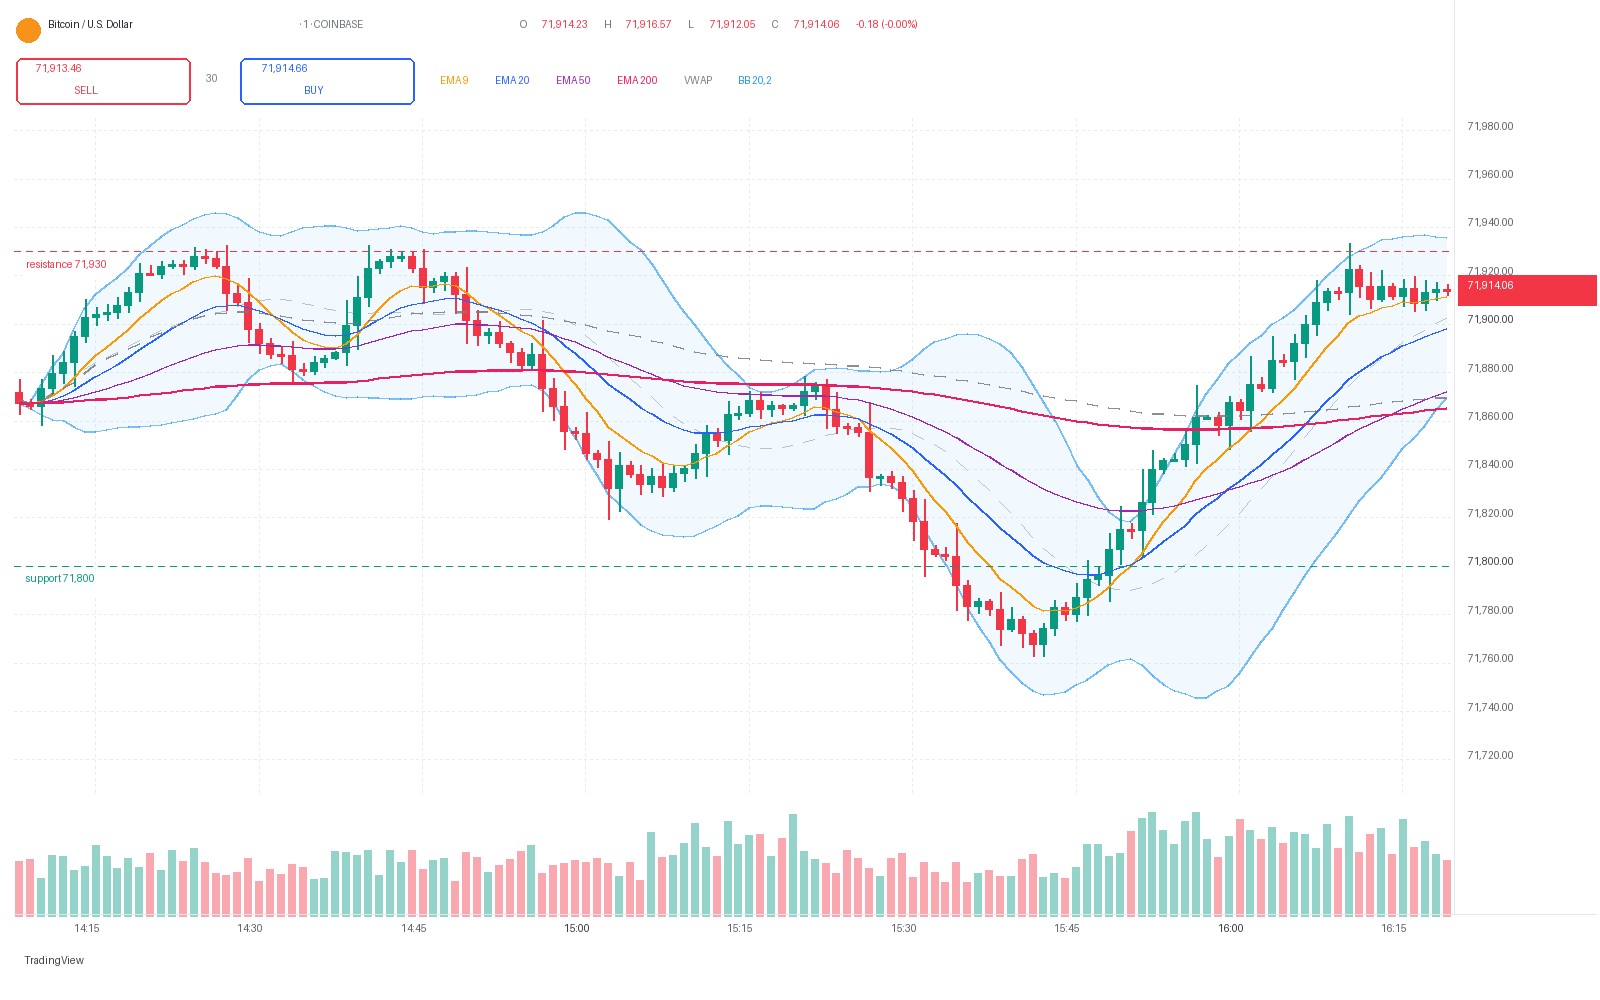
BTCUSD_1m_screenshot.png — uploaded by a trader, analyzed in seconds.
- Higher low printed right on the 200 EMA — The 15:45 dip to 71,763 was bought straight off the flat 200 EMA (71,865) and held above the earlier 15:30 low — sellers could not press price under the long-term average on the second attempt.
- The two-hour downtrend has been broken — After the 14:25 and 14:45 rejections price stair-stepped lower for an hour, but the last leg has closed back above the 9, 20 and 50 EMAs, and the 9 EMA has crossed back above the 20.
- 71,800 flipped from resistance to support — The shelf that capped the 15:20 bounce was reclaimed on the way up and then held on the final pullback — role reversal, and it marks exactly where this idea stops working.
- Price is riding the upper Bollinger band into 71,930 — The bands expanded on the recovery leg and price is tracking the upper band while sitting above VWAP (71,870) — momentum is with the buyers as they press the 71,930 ceiling for the third time.
- Volume is expanding on the up-candles — The green minutes since 16:00 are printing the heaviest volume of the whole session, while the earlier slide happened on steadily thinning red bars.
Over the last two hours BTC was rejected twice at 71,930 and stair-stepped lower, but the slide stopped on the flat 200 EMA and printed a higher low at 71,763. The recovery has reclaimed the 9, 20 and 50 EMAs, flipped 71,800 back to support, and price is now riding the upper Bollinger band above VWAP into that same 71,930 ceiling on expanding volume. Longs are favoured while price holds 71,800 — a break of 71,930 opens 72,010, then 72,140.
Third test of 71,930 breaks and price clears the session high → 72,010 (measured move from the recovery leg)
55%Invalid if A 1-minute close back below 71,800
Slow grind higher along the 9 EMA before the breakout attempt → 72,140 (extension target)
25%Invalid if 9 EMA rolls back under the 20 EMA and price loses VWAP
Third rejection at 71,930 sends price back to the 71,800 shelf → 71,800 – 71,763 area
20%Invalid if Losing 71,763 would end the intraday bullish structure
A 1-minute Bitcoin chart covering the last two hours of the session. The 200 EMA (71,865) held the 15:45 low, the 9 EMA has crossed back above the 20, price is above VWAP (71,870) and tracking the upper Bollinger band, volume is heavier on the up-candles, and the reclaimed 71,800 line is the level that keeps this idea valid.
Sample analysis. Upload your own chart and you get a fresh plan written the same way — entry, stop-loss, take-profits, reasons and scenarios, in plain English.
Educational analysis only — not financial advice. Do your own research.